Nudging farmers and wine growers for better land management

Nudging farmers and wine growers for better land management

Ruban and Heather had recently decided to make a change in their lives. They spent decades working in the city in dead-end jobs, going into their offices every day to play out the same routine day after day. They chose to quit their jobs, sell their house and buy a small farm in the country. After a year on the farm they had started learning the ropes. Ruban and Heather had begun to learn about the Agri-Environmental Schemes (AES) that are designed to address environmental issues but often wondered how effective these schemes were, and how governments were able to promote the use of these schemes to farmers and wine growers.

Nudging is technique in behavioural economics and decision-making that has been successfully used to promote better land management across the world (Duflo et al., 2009; Kuhfuss et al., 2016). Nudging involves the manipulation of ‘choice architecture’, that is the default in a decision, or how a decision is laid out to improve decisions-making.

An interesting example of the application of nudging to promote efficient fertilizer use comes from Kenya (Dufflo et al., 2009). In Western Kenya farmers grow mainly maize in the two annual agricultural seasons. Farmers often fail to take advantage of the use of fertilizers. Many agricultural experts see the use of fertilizers as key to agricultural productivity, as such, governments invest heavily in fertilizer subsidies. In India, 0.75% of the GDP is spent these subsidies (Gulati & Narayanan, 2003), whilst in Zambia 2% of the GDP goes towards these subsidies (World Development Report, 2008). An alternative strategy to increase the use of fertilizers is to use nudging (Duflo et al., 2009). Nudging has been used effectively in the form of time-limited discounts were the discounts are applied at the most beneficial time for buying fertilizer – this method has worked well in promoting the use of fertilizer in Western Kenya. An added benefit of these discounts is that the heavy government subsidies are no longer needed when nudging is used correctly.

Image 2

A second study to investigate the use of nudging in farm land management was conducted by researchers at the University of Glasgow (Kahfuss et al., 2016). They examined the use of Agri-Environmental Schemes (AES) which are widely used in the European Union (EU), United States (USA), and Australia. These are schemes in which land owners sign individual contracts and volunteer to implement pro-environmental managements in return for an annual payment. In the period 2007 to 2013 the EU spent approximately 22.7 billion euros on the schemes through contracts that last 5 years (France) to 20 years (UK). An alternative to using these AE schemes is to use nudging in the form of social norm nudges. Social norm nudges work because when your neighbour is said to act in certain way it increases the chances of you acting in the same way. Kahfuss and colleagues (2016) examined the use of social norm nudges in a survey to 395 French farmers. They provided framed information about what other farmers intend to do with their land. Through this study they found that simply stating that other farmers intend to act in a pro-environmental way was enough to increase the likelihood of the questioned farmers to act in the same way. In this study nudging was demonstrated to be a very effective alternative to the AE schemes with the added benefit that nudges are an efficient tool that work with no added cost.

Image 1

A third study to demonstrate the effectiveness of nudges on farmers was conducted on wine growers in the South of France (Kuhfuss et al., 2015). Like the previous study be Kuhfuss (2016) social norm nudges were found to be an effective way in persuading farmers, in this case wine growers, to adopt less pesticide-intensive farming practices.

Overall nudges can be an efficient tool in persuading farmers and wine growers like Ruban and Heather to act in environmentally friendly ways. These nudges can save governments a lot of money by working in a cost-effective manner. If implemented correctly these nudges can free up significant funds to be spent elsewhere in government budgets.

The recognition heuristic in sports betting predictions.

The recognition heuristic in sports betting predictions.

Stuart and Penny enjoyed to travel, on this occasion they took advantage of the excitement over the world cup as an excuse to go on holiday. They saw the sights, enjoyed the local delicacies and watched a few matches. Stuart decided to place a bet on one of the matches but had never gambled before. Penny noticed that many people when betting simply chose the team, or athlete, that they were familiar with as the winner. Since neither Stuart nor Penny had gambled before and they did not know a lot about the athletes they both agreed that choosing the familiar team as the winner was the best way to gamble.

When gambling on the outcome of an event such as a football match, tennis match, or even a golf game many people predict that the familiar athlete or team will win. Regardless of the type of event or scoring criterion choosing the familiar is often the strategy that is used by laypeople (i.e., non-experts). This ‘familiar strategy’ is called the ‘recognition heuristic’ (Gigerenzer & Goldstein, 1996). The recognition heuristic has been studied extensively in the decision-making literature with many different examples of predictions for sporting events.

image 2

Researchers from the University of Illinois investigated the role of the recognition heuristic when making predictions about the outcome of basketball matches (Jacobson et al., 2009). Jacobson and colleagues (2009) choose to use basketball from the National Collegiate Athletic Association (NCAA) as the medium to study the recognition heuristic. In 2007 alone, an estimated $2.25 billion US dollars was bet on the final four rounds of this basketball tournament (McCarthy, 2007). Of the teams to get into the final four rounds 70% of these teams were highly seeded. Gambling records show that the favourite teams were over-backed when betting.  The researchers used data from matches between 1985 and 2009. They asked people to predict the outcome of basketball matches based on very little information – just the names of the teams. The results revealed that most of the participants used the recognition heuristic, predicting that the well-known basketball teams would win the match.

A second experiment that used basketball data to investigate the role of the recognition heuristic utilised data from the National Basketball Association (Hall et al., 2007). One hundred and sixteen undergraduate students from Princeton University took part in the experiments by Hall et al (2007). Firstly, participants were asked to list as many NBA teams as they could recall. The data from sixteen games involving these teams was then selected. In this experiment all participants received statistics (win record, halftime scores), and half the participants received the names of teams (e.g., NY Knicks vs NJ Nets). Participants attempted to predict the outcome of games based on the information they received. The Los Angeles Lakers are a very familiar team with many people but did not have the best statistics – if using the recognition heuristic participants would ignore the statistics and predict the LA Lakers as a winner (unless against a more familiar team). Contrary to the recognition heuristic most people would expect that the more information we are given the better we can make predictions. The results of this study found that participants overestimated the chances of winning for familiar teams – using the recognition heuristic.

image 1

The recognition heuristic has also been studied with football (soccer) data (Pachur & Biele, 2007). In a third study laypeople and experts were asked to make predictions about the outcome of football matches in the 2004 European Soccer Championship. Pachur et al (2007) investigated five mechanisms for making predictions. Although the experts made more correct forecasts than laypeople the recognition heuristic accounted for 90% of all predictions made – the recognition heuristic was found to be an effective way to make predictions based on little information.

In the case of tennis, the recognition heuristic has also been investigated (Serwe & Frings, 2007; Scheibehenne & Arndt, 2007). In one study using data from the 2003 Wimbledon tournament 90% of predictions made when a recognised player was against an unrecognised player relied on the recognition heuristic to make predictions (Serwe & Frings, 2007). The final study used data from the 2005 Wimbledon tournament (Scheibehenne & Arndt, 2007). Amateur tennis players and laypeople were asked about which tennis players they recognised. Laypeople recognised only 11 or the 128 players (9%) on average, whilst amateur tennis players recognised 49 players (39%) on average. Here the recognition heuristic accounted for 70% of all predictions made about the winner of a tennis match regardless of whether the person making the prediction was an amateur tennis player or layperson.

image 3

As we have seen the recognition heuristic accounts much of the predictions made when forecasting the outcome of sporting events. Like Stuart betting for the first time many of us use the recognition heuristic whether we know about the heuristic or not. Although at first thought making predictions based on very little information seems like a bad idea the recognition heuristic can often help in making the correct predictions, after all, familiar teams are normally the most successful teams. So, if you are placing a small bet on a sporting event and you are a layperson (not an expert in the sport) then it is likely that this heuristic will be very useful tool in the decision-making toolbox.

Behavioural economics interventions towards promoting higher gym attendance – how commitment contracts can boost gym attendance and reduce obesity.

Behavioural economics interventions towards promoting higher gym attendance – how commitment contracts can boost gym attendance and reduce obesity.

Lisa went to the gym regularly every week. She took advantage of the different exercise classes that her local gym offered throughout the week. Lisa’s friend Howard had wanted to start going to the gym since the start of the new year and noticed how often Lisa went, they often talked at work about the different exercise classes that were available. Although he wanted to start going to the gym Howard struggled to put in the effort to actually attend a gym. After searching around the internet Howard read about commitment contracts and thought that if this helps him become more physically active he would give it a try.

The lack of physical exercise and increasingly sedentary lifestyles that many people live have in part contributed to a major health challenge. Rates of obesity and obesity-related diseases have been on the rise in many countries over the last couple decades. The health issues that are associated with obesity are now some of the most expensive challenges to healthcare systems worldwide. Interventions from behavioural economics can help reduce the financial impact of obesity by making small changes to behaviour.

image 1

Exercise commitment contracts are a small intervention that can be used to increase gym attendance and therefore help in reducing obesity (Goldhaber-Fiebert et al., 2010). The principle behind these exercise commitment contracts is that the user selects the duration of a contract and if they fail to live up to the contract there is a small financial penalty. Commitment contracts have proven to be effective in smoking cessation (Gine et al., 2008), saving plans (Ashraf et al., 2006) and other weight loss interventions (Volpp et al., 2008) – there is also a popular website for making these contracts (Stick[dot].com). A study by Goldhaber-Fiebert et al., (2010) found that these contracts help with forming long-term habits (i.e., getting into the habit of going to the gym) when the durations of these contracts are set to 8, 12, or 16 weeks.

image 2.png

A second study to investigate how commitment contracts can be used to increase gym attendance used a slight variation on the financial penalty contracts (Goldhaber-Fiebert et al., 20104; Lioto & Carman, 2014). Lioto and Carman (2014) randomly assigned obese participants in the United States to one of three treatment groups: 1) monthly weigh-ins, 2) a lottery and 3) a deposit contract incentive system. In the deposit contract group participants committed to between $0 and $252 per month of their own money with aim towards losing weight (participants decided on how much money to commit). Upon meeting their self-set weight loss goals the money was returned to them with 1:1 ratio (e.g., losing 15 pounds in 15 weeks). If participants failed to meet their goal then the money was forfeited.

So, if like Howard you want to lose weight by attending a gym on a regular basis but you are struggling to make this a long-term habit one route to achieving your goal could be through the use of commitment contracts. We have seen that commitment contracts are effective in achieving several aims (smoking cessation, saving plans), and that there are different types of contracts that have proven to be effective (financial penalties & deposit contract systems). Variations on these contracts could also be one of the many tools that can aid in the reduction of rates of obesity.

The denomination effect in consumer spending behaviour.

The denomination effect in consumer spending behaviour.

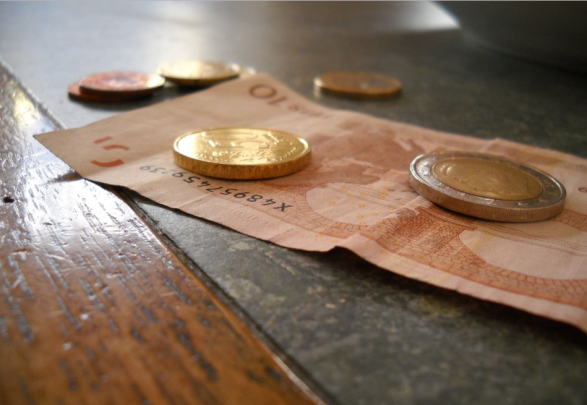
Serina had just got off her train to London on the normal weekday commute. Once arriving in London on the way to her office she always stopped at a local supermarket to buy her lunch for later in the day. Serina enjoyed trying different foods from the deli counter. Today she picked up her lunch headed to the cashier and searched around in the bag for some change, she disliked having loss change so preferred to get rid of it whenever possible. Serina found a £10 note and about £10 in coins, she picked up a little snack, payed with the coins and continued on to work. Like most of us Serina spent any coins she had before breaking into a new note.

The study of decision-making and spending behaviour is important because in the long-term, over the course of a year or years, spending a little less (or more) money every day can have a big impact on our finances. One of the spending behaviours that most of us don’t think about, but still do, is that we prefer to spend coins more than notes (bills in the U.S.). The denomination effect suggests that when an individual possess two equal amounts of money we are more likely to spend the smaller denominations (e.g., 10 x £1 coins) then a larger denomination (e.g., a £10 note) (Raghubir & Srivastava, 2009; 2016). Furthermore, we evaluate transactions more positively when an identical amount of money is framed as “pennies a day” (e.g., £1 a day) rather than aggregately (e.g., £365 a year) (Gourville, 1998).

image 1

Although the denomination effect isn’t well known cognitive bias in the academic literature it has been studied extensively by its discoverers in series of experiments since its discovery in 2009 (Raghubir & Srivastava, 2009;2016). In the first study eighty-nine business student undergraduates were recruited from two U.S. universities, they were recruited to either a large denomination condition ($1 bill) or a small denomination condition (four quarters). Participants were given the choices of what sweets to the money on which consisted on sweets valued at 25 cents of a dollar each depending on the condition. Across the two conditions participants were more likely to spend when given four quarters than the $1 bill, which is consistent with the denomination effect. Despite the $1 bill not being a large bill, the denomination effect was still found.

image 2

The second study by Raghubir and Srivastava (2009) recruited seventy-five drivers at gas (petrol) stations in the Midwest of the U.S., they were asked to take part in a quick survey in which three questions were asked about fuel spending behaviour as a cover for the actual study. The drivers were given $5 in one of three forms; five $1 bills, five $1 coins, or a $5 bill. The different forms of $1 (coins or bills) allowed for a control. An important note here is that some participants choose to keep the $1 coins as souvenirs because of the rarity compared to bills. The drivers were then allowed to spend the money on whatever they wanted in the gas station shop with the condition that they provided the receipt and information about the manner of purchase (i.e., card or cash). Here, the researchers found evidence of the denomination effect – non-petrol related were higher for the five $1 bill group (at 24%) compared to the single $5 bill group (at 16%).

So, like Serina if you ever wonder why we tend to prefer to spend our low denomination money more than equal value high denomination money one explanation is the denomination effect. We tend to value lower denominations less then high denominations without paying a lot of attention as to why we do this. Perhaps next time you find yourself searching around for cash in your bag when at the shops beware that some of your spending habits may be driven by denomination effect.

Green nudging, how can nudges improve recycling

Green nudging, how can nudges improve recycling

Andrew and Peter were going through the weekly ritual of pressing down all of the recycled waste into their recycling bin, dragging it along the driveway and leaving it for the weekly bin collection. As they did this Peter mentioned to Andrew that there is so much waste that can be recycled since almost every product we buy in shop is packaged in plastic or card now. They both looked up the street noticing that some of their neighbours didn’t put out a recycling bin. As they walked back inside Andrew remarked to Peter that “Why is that some people recycle and other don’t? Can’t anything be done to improve recycling? Recycling benefits us all.”

Over the last sixty years many countries we have seen as large increase in the amount of plastic and card packaging being used to package the products that we buy in shops. Some of the companies that choose to package their products in these ways ensure that their packaging can be recycled into other goods once the consumer has finished with the product and placed the packaging in the recycling bin. This is where one of the biggest problems in recycling arises – how do we persuade more people to recycle their recyclable waste? An example from Norway emphasises the importance of recycling …. in Norway alone, the average waste generated by a single person in 2012 was 430 kg this is twice as much as it was just 20 years before. Year-by-year the average amount of waste that we all generate will likely increase.

So, how can nudging help? For those that aren’t familiar with nudges let me start with some examples of what nudges are and how they work. If you have ever been to a hotel in Europe in the last decade you are likely to have noticed a sign in the bathroom near your towels asking you to conserve water by reusing your towels. Many hotels attempt to conserve water by using this little sign now. This is a nudge, a change in the choice architecture (i.e., making it easier to make a environmentally friendly decision) that is designed to aid decision-making. Since the introduction of these towel signs there was has been an increase in the rate of towel reuse from 35.1% to 44.1% (Goldstein et al., 2013). A second example of a pro-environmental nudge is in household energy consumption. In 2012, one local utility in Southern Germany’s Black Forest began to default its energy consumers to a renewable energy tariff unless they explicitly choose to opt out (Sunstein & Reisch, 2013). The important thing in nudging is that decision makers always have the option to opt out of the nudge, thee nudges simply aid in making effortless decisions.

Image 1.png

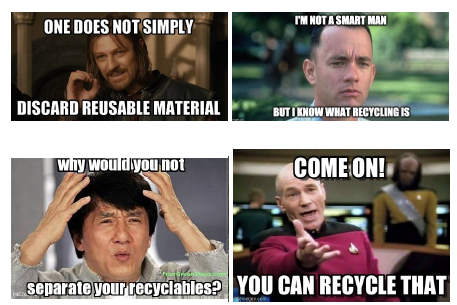
There are many ways in which nudges can be applied to the problem of improving recycling rates. One of the easiest ways is to strategically design and place signs to promote recycling. One study that aimed to improve recycling rates across six university campuses in Germany investigated the effectiveness of different types of signs (sings with text, pictures, memes etc) (McNabb et al., 2017). They found that simple sign with a recycling symbol and a small amount of text when placed near recycling bins statistically improved recycling rates. Unfortunately, they found no increase in recycling when placing recycling-related memes nearby (see image below for examples). The improvement in recycling works across universities across the world. At US universities informative signs and placing the bins in closer proximity to walkways both increase recycling rates (Miller et al., 2016).

memes for recycling

A second type of nudge that significantly improves recycling is to provide a personalised letter to individuals (Milford et al., 2015). A randomised study of nine thousand households in Norway investigated how nudging through the use of personalised information about own recycling rates and waste habits compared to other people in the same municipality can improve recycling. They found that sending a letter to the household with all of this information was enough to increase the share recycled waste by 2 percent of the first 7 months of the study. If the letter then went further to provide advice about how to recycle more then there was more of an increase.

Image 2.png

So, if you are like Andrew and Peter and you care about the environment you should recycle as much as you can. The problem is in making recycling easier for those people that do not pay much attention to the need to recycle. We have seen that simple nudge to our everyday environment can be an effective way to boost recycling rates. Simply, strategically placing signs around the place of study or work reminding people where the recycling bins are helps. Even, a more direct approach of sending personalised letters to the household significantly increase recycling rates. Perhaps with the careful application of nudges over time future generation won’t have the issue of recyclable packaging going to waste.

The status quo bias when casting a ballot.

The status quo bias when casting a ballot.

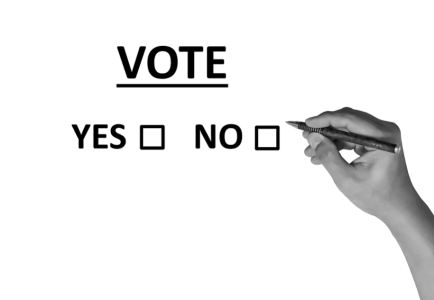
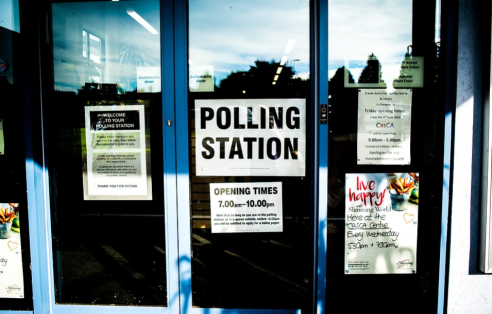
Jane and Robert enjoyed living in a country with a direct democracy system. They valued their right to directly vote on important issues that effect everyone. Whenever there was a public ballot they’d always attend to ensure their voices were heard by casting their ballots. They cast their ballots on issues such as drug policy, health care, finance and domestic policy.

Public ballots are important because they allow the public to directly influence, and have their say on, the direction of important government policies at the national and local level. Some ballots even include multiple propositions. Countries like Switzerland, Italy and the United States have regular public ballots. In the Italy there were 15 ballots between 1971 and 2004, in the United States there were 159 state-wide ballots in 2015 (across 42 states), and between 1960 and 2004 there were 125 ballots in Switzerland. At the local level there have been over 700 ballots in California and Oregon between 1970 and 1998.

image 1

Given that some of the ballots ask the public to decide on multiple issues (propositions) behavioural scientists have begun to investigate the impact that cognitive biases may have on voting behaviour. Since ballots can be concerned with a wide range of topics and the outcomes of ballots are often close even the smallest impact of cognitive biases can have a big effect. The status quo bias refers to one such bias, which is the tendency to prefer one option over another because the option is the status quo (Samuelson & Zeckhauser, 1988; Kahneman et al., 1991). Barber and colleagues (2017) investigated the impact of the status quo bias in a study by manipulating the wording of experimental ballots. They gave participants ballots on the topics of gambling, mental illness and same-sex marriage with neutral or biased (against or in favour) wording. The results indicated that the wording of the ballots had an impact on voters, furthermore the status quo bias influenced participants who were not well informed about the proposition (e.g., mental illness).

table 1
One study that investigated the length of public ballots reported that multiple propositions on a ballot can interfere with the ability to translate political preferences into consistent policy choices (Selb et al., 2008). This is important because although some countries run regular ballots simply changing the order and number of propositions can influence the outcome. At the national and local levels alike, the length of these ballots vary greatly (see Table 1). In the Californian and Oregon ballots there was a status quo effect on almost 700 ballots between 1970 and 1998 (Bowler & Donovan, 1998). For every additional proposition that was added to these local ballots the share of ‘No’ votes increased on average by 0.4 percent.

image 2.png

The status quo bias is not the only cognitive bias to influence voting behaviour on public ballots. The endowment effect and loss aversion can also explain some of the resistance to change through ballots (Heinemann, 2001). So, like Jane and Robert if you live in a country or state that has a direct democracy system and you enjoy taking part in public ballots one way in which you can avoid the effect of cognitive biases is to read and think carefully about the proposition at hand.

Heuristics in the age of the smartphone: how do heuristics help us decide which app to buy from the app markets?

Heuristics in the age of the smartphone: how do heuristics help us decide which app to buy from the app markets?

Louis had just been given a new smartphone for Christmas, he’d wanted a new smartphone for some months now. He charged the phone, setup his contacts and began to browse through the app stores. He searched for useful apps and entertainment apps. Whilst browsing the app store he noted that among the hundreds of apps a small selection of the apps were prioritised by positioning the apps at the top of the app list. Louis wondered some of the apps were displayed in a better position than others. He didn’t give it a second thought and continued to load apps onto his new smartphone.

Smartphone apps are small computer programmes that have become a useful and sometimes important part of life. These small apps have helped to change mobile phones from a basic communication device to a small personal computer that can complete a myriad of functions (e.g., listening to podcasts, searching the internet, playing games). The apps that enable the large variety of functions are primarily available through proprietary online shops such as Google’s Play Store, Apple’s App Store, and Amazon’s App store, these apps can be created by skilled computer programmers. Since the advent of smartphones (mobile phones with the ability to use apps) over a billion smartphone have been sold and 50 billion apps have been downloaded worldwide (ABI Research, 2013).

image 1.png

The popularity of smartphone apps have lead researchers to investigate how and why we choose to download one app whilst ignoring the vast amount of other apps that available. For example, when searching for a messaging app one must pick one app with the desired attributes from among a vast collection of apps that are all very similar. Some of the aids when choosing an app include graphic rating systems (Gage Kelley et al., 2013) and customer reviews (Poster Felt et al., 2012). Decision-making researchers have found that users (consumers) spend more time reading customers reviews than the privacy permissions, despite the importance of clearly understanding what you ought to allow the app to access on your smartphone (Should you rely allow a game to access your phone call log or photos?) (Porter Felt et al., 2012). Other researchers have revealed that graphic rating systems are considered to be a more reliable source of information and quality of an app than full-text customer reviews (Gage Kelley et al., 2013). Many user prefer to simply look at the number of stars that an app has been given by other users rather than reading customer reviews.

image 2.png

One exploratory study by researchers at universities in Germany and the United States sought to investigate what decision strategies are used when deciding which app to download from an app store (Dogruel et al. 2015). They recruited 49 smartphone users with experience of the Google Play Store and asked them to browse through a total of 189 apps, after which they chose three apps to download from different categories. The researchers used screen capture software to monitor and record the activities of the participants so that they could observe which decisions were made. The researchers found that half of the selected apps (n=93) were chosen from the default list at the top of the screen, here the participants did not scroll down to look any other apps. In just 1 in 4 cases (approx. 48) apps were selected after viewing at least 10 other apps. The Take-the-first (TtF) heuristic which states that a user simply chooses the first option that they encounter explains about half of the decisions that were made.

So, like Louis if you have recently received a smartphone as a gift or had bought one and are now filling the smartphone with useful and entertaining apps, remember that many of the most popular apps (in the default list) may have simply been chosen by other users because of the Take-the-first heuristic. We like to think that we decide which app to download carefully however heuristics like Take-the-first can explain some of our decisions. As apps become more popular with the advancement of technology the heuristics-and-biases literature can inform us about how we make these decisions, decisions that app store creators can use to their benefit to make greater profit.

The Take-the-best heuristic in election forecasts

The Take-the-best heuristic in election forecasts

Denise and Thomas were sat having their lunch in the staff room. As always, their discussion turned to politics, they talked about how much the politics of United States and Europe have changed in the last year. Like many people Denise and Thomas did not expect the dramatic change in leadership. Denise remarked that there was not way that anyone could have predicted the political shift.

The forecasting of political votes (i.e., elections etc) is important as many businesses and governments make long-term plans, an incorrect prediction can cost a lot of money. Forecasts often predict shifts in political leadership that represent the political views of the majority of voters. The forecaster’s models for predicting the outcome of elections must therefore take a lot of factors into account that include public opinion polls, the candidate’s issues and the candidate’s popularity. Many of the forecasting models are complex but what if there was a quick and easy way to predict the outcome of an election?

image 1.png

The take-the-best heuristic is one of the decision-making short-cuts (heuristics) that can be taken from the cognitive psychology literature and adapted to political forecasting. The take-the-best heuristic enables users of the heuristic to choose between two competing alternatives with ease by comparing the values, or attributes, that they both share (Gigerenzer, 1999). When making a simple decision about which of two products to buy you can compare the products on attributes that are important, for example … how much memory does a laptop have? how many USB ports does it have? The take-the-best heuristic states that the laptop with the best (or largest) amount of memory and number of laptops will be chosen.

The recent U.S. Presidential Election in 2016 saw Donald Trump beat Hilary Clinton to become the President to the surprise of many observers. The forecasting models predicted a close election but ultimately a win for Hilary Clinton. Clinton won the popular vote but not the electoral college vote. In the popular vote Clinton had almost 3 million more votes than Trump with 51.1% to Trump’s 48.9%. Importantly in the U.S. it is the electoral college votes (of which Trump had more) which decide the presidential election, not the popular vote. Historically, there’s very little variance between the popular vote and electoral vote (Graefe et al., 2017)

image 2.png

Before the election of Trump to the Presidential office in 2016 researchers at the Karlsrube Institute of Technology in Germany and the University of Pennsylvania (in the U.S.) began to investigate the accuracy of political forecasting models (Graefe et al., 2012; 2013; 2014). The researchers compared the performance of forecasting models to simple heuristics such as the take-the-best heuristic. They developed a simple model that uses a variation of the take-the-best heuristic called the Big Issue voting model (BI-H model). The BI-H model identifies the issue that is most important for voters (e.g., higher wages, health care insurance) and predicts the candidate that is most likely to win based on the public support for this issue. When tested against other forecasting models the BI-H outperformed the more complex models.

Since the average person has little interest in politics, models that use simple heuristics like the take-the-best heuristic can be used to accurately predict the outcome of elections. There is one caveat though that two-step electoral systems (i.e., popular vote & electoral college votes) can make predicting the outcome of elections even harder. Nonetheless, when data from the popular vote is feed into the BI-H model the heuristics can easily outperform complex models. It clear that a great deal more work needs to be done in political forecasting but heuristics-and-biases can help in the development of forecasting models.

Nudging down theft of bicycles and from parked vehicles

Nudging down theft of bicycles and from parked vehicles

Hugh and Liz had just bought a new house. They had wanted to upgrade to a larger house for many years and now decided on an area to move to. Before moving home, they looked at the crime rates, schools for their children, local amenities for shopping, and things to do. The house seemed perfect so there was no hesitation in arranging the move. In the weeks following moving in to their new home they received all the usual junk mail, most of which went straight into the bin. One of the leaflets that they received through their letterbox was a leaflet saying to remember to check that they have locked their car, Hugh and Liz thought that was a nice a reminder and continued with their day.

Nudges are small, cheap and subtle modifications of choice architecture (i.e., changing a default option to the most favourable outcome) that can be used to help an individual make a better decision. Thaler and Sunstein published the idea of using nudging in the highly influential book ‘Nudge’ in 2008. Recently Richard Thaler has gone on to win the Nobel Memorial Prize in Economic Sciences for his work on nudging.

image 1

Nudging has been used to aid decision-making in many ways. In crime prevention nudging has helped to reduce thefts from parked vehicles (Roach et al., 2016). A pilot study in County Durham in the North of England between September 2015 and October 2015 investigated how nudging can be implemented to reduce thefts from cars. Firstly, Roach and colleagues examined the reasons for cars being left insecure finding that there are three reasons: i) forgetting to securely lock a car whilst going into a shop, ii) forgetting to lock a car on one’s driveway, and iii) forgetting to lock a car outside or adjacent to one’s property. They choose four target areas (2 x experimental and 2 x control) and tailored their nudging technique to the local demographic. One of the basic principles of nudging is that nudging is more effective when the message is tailored (i.e., worded or presented) to the recipient. Leaflets were distributed with simple messages saying to “Take care of your vehicle” and “More than 1/3 of thefts in your area involve unlocked cars. Why? Because it’s ….. EASY.” The results of this found a significant reduction in thefts from cars because reminding car owners to lock their cars reduced the number of opportunities for thieves. In the two experimental areas there were reductions of 33% and 25% in crime compared to the crime statistics of the last 3 years.

image 2

Another type of theft that nudging has aided in reducing is bicycle theft (Johnson et al., 2008; Nettle et al. 2012). In countries and cities where cycling is a popular past-time and way of commuting bicycle theft can be a major problem. Police statistics indicate that in England and Wales between April 2011 and May 2012 there were 115,905 bicycles thefts. Traditional interventions to tackle theft include (i) registering bicycles with local police forces, ii) improving bicycle parking facilities, and iii) improvements to bicycle locks and how they are applied. On average CCTV surveillance cameras alone only reduce crime by 7% (Nettle et al. 2012).

Simply placing small stickers depicting how to secure the lock correctly on parked bicycles has been an effective way in reducing bicycle theft (Sidebottom et al., 2009). A second nudging intervention at university locations found that placing signs with ‘watching eyes’ (an image of a pair of eyes) near bicycle stands reduced bicycle theft levels (Nettle et al., 2012). These signs decreased bicycle theft by 62% over 12 months.

We have seen that nudging can be used as a subtle technique to tackle crime rates. Nudging can take the form of small, cost-effective interventions such as distributing leaflets (Roach et al., 2016), strategically placing stickers (Sidebottom et al., 2009) and placing ‘watching eye’ signs near bicycle stands (Nettle et al., 2012). So like, Hugh and Liz moving into their new house if you receive a leaflet through the post simply reminding you to lock your car it may that nudging is being subtly used to reduce crime.

Hot-hand bias in rhesus monkeys (Macaca mulatta).

Hot-hand bias in rhesus monkeys (Macaca mulatta).

Henry and Elizabeth were at the zoo for a day out with their children. They walked around watching the birds-of-prey displays, elephant feeding and the primates. When they got to the rhesus monkeys it was feeding time. The monkey enclosures had food placed strategically in trees, on platforms and on top of boxes. One of Henry and Elizabeth’s children noticed that the monkeys moved around the enclosure a lot but kept on returning to the same part of the tree where the food was placed, she wondered why the monkey acted in this way.

One of the most interesting patterns of behaviour is the ‘hot hand bias.’ The hot hand bias was first observed in basketball players, it posits that we perceive a positive serial autocorrelation in independent sequential events (Blachard et al., 2014). In basketball players the hot band bias reflects the tendency to perceive that a player’s chance of hitting a shot is greater following a string of successful shots rather than misses. The hot hand bias goes against statistical probabilities that argue that past events (i.e., success shot in a basket) have no influence on current or future events (i.e., the current shot at the basket).

image 1.png

The origin of the hot hand bias remain unknown, in recent years researchers have begun to investigate the bias in animals that we share common ancestors with (Blanchard et al., 2014; Calhoun & Hayden, 2015). In 2014 researchers from the University of Rochester examined the hot hand bias in rhesus monkeys (Macaca mulatta) (Blanchard et al., 2014a). Blanchard and colleagues hypothesised that the hot hand bias is an adaptation to foraging in clumpy environments (i.e., environments with plentiful resources). The three monkeys in their study performed a novel gambling task. The results indicate that there were correlations between sequential decisions, for every sequential choice the change of choosing an option increased. The monkeys had better performance for clumped rather than dispersed distributions. These results support the suggestion that the hot hand bias evolved early during humanoid evolution and is an ancient bias.

image.png

A second study by the same research group at the University of Rochester examined decision biases in another three rhesus monkeys (Blanchard et al., 2014b). The monkeys performed a similar task to the first study where researchers gave monkeys a sequence of rewards to choose between and the choice to repeat the same sequence or start a new one. The findings indicate that adding a small reward to the end of a sequence can reduce its value. This study supports the cross-species nature of decision biases and that these biases have evolutionary ancient origins.

A third study to investigate the evolutionary origins of decision biases in monkeys trained monkeys to perform a computerized version of a foraging decision task called the patch-leaving task. The monkeys could make a choice between moving between two patches of food, one in the foreground and the other in the background. When the monkey chooses to ‘move’ from one patch to the other there is a delay called travel time that results in a delay between receiving rewards. When adjusted for travel time there was nearly optimal performance across all of the monkeys. This study suggests that the foraging context (i.e., patches and delay) can reduce the influence of decision biases (Calhoun & Hayden, 2015).

Taken together these studies demonstrate that humans and monkeys alike share some of the same decision biases that have evolved over the course of evolution. The decision biases that we observe in all animals (including humans) have evolved to aid in survival by ensuring sufficient food through foraging. When Henry and Elizabeth took their children to the zoo the monkey’s behaviour reflected one of the many uses of the hot hand bias as it repeatedly went back to the place where the food was waiting.